Part 1
Brief Introduction of companies
Marks and Spencer
This firm counts among the leading retailer of the UK who provides variety of services in order to please their buyers (Marks&Spencer, 2016). The current business is listed in the London stock exchange with a constituent of FTSE 100 indexes which signifies its legal identity. This firm specializes in the selling of clothing, home products and luxury food products. This gain competitive advantage over Primark by offering food products other than just providing clothing services. The current firm has chosen for this analysis on the basis of its one of the segment that is supermarket sector.
Sainsbury
It is famous for offering variety of grocery products which increases the importance and status of this entity in the external market. This is regarded as the second largest supermarket chain in the whole UK. The current market position of this entity is not good as the biggest global competitor Tesco has overtaken this firm (Sainsbury, 2016). The Tesco being a global competitor affect the performance of this firm by reducing its market share with a remaining share of 16.9%. The selection of this entity for the analysis in the current report in assessing the supermarket sector. The efficiency of the supermarket sector in relation with the food and other kinds of grocery products offered by the Marks and Spencer.
You Share Your Assignment Ideas
We write it for you!
Most Affordable Assignment Service
Any Subject, Any Format, Any Deadline
Order Now View Samples
Ratio Analysis
This is regarded as one of the important tool used in the comparison of the previous year figures of the firm with its actual results (Clark, 2016). The ratio analysis is important tool used by the management of both the firm in order to assess the financial statements. The financial performance of the company are judged by categorized into various segments such as profitability, liquidity, efficiency, investment and solvency ratios.
Table 1: Ratios of Marks and Spencer
|
Particulars
|
Formula
|
2013
|
2014
|
2015
|
|
Profitability ratios
|
Â
|
Â
|
Â
|
Â
|
|
Net sales
|
Â
|
10027
|
10310
|
10311
|
|
Gross profit
|
Â
|
3797
|
3871
|
3986
|
|
Net profit
|
Â
|
467
|
525
|
487
|
|
Operating profit
|
Â
|
664
|
599
|
620
|
|
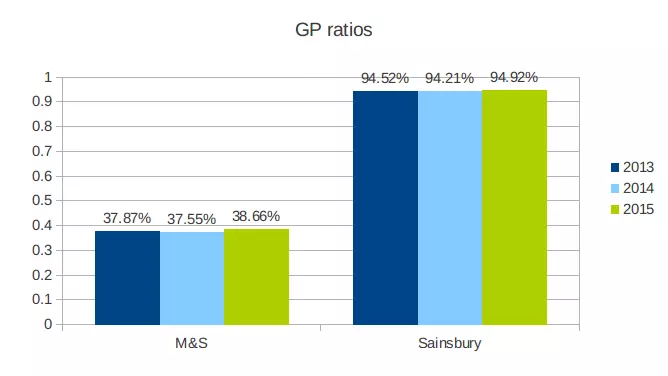
GP ratio
|
Gross profit/Net sales*100
|
37.87%
|
37.55%
|
38.66%
|
|
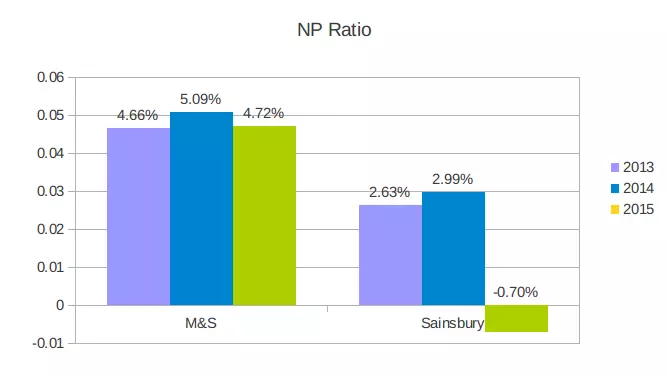
NP ratio
|
Net profit/Net sales*100
|
4.66%
|
5.09%
|
4.72%
|
|
Operating profit ratio
|
Operating profit/Net sales*100
|
6.62%
|
5.81%
|
6.01%
|
|
Liquidity ratios
|
Â
|
Â
|
Â
|
Â
|
|
Current assets
|
Â
|
1268
|
1369
|
1455
|
|
Current liabilities
|
Â
|
2238
|
2349
|
2112
|
|
Inventory
|
Â
|
767
|
846
|
798
|
|
Quick asset
|
Current asset-inventory
|
501
|
523
|
657
|
|
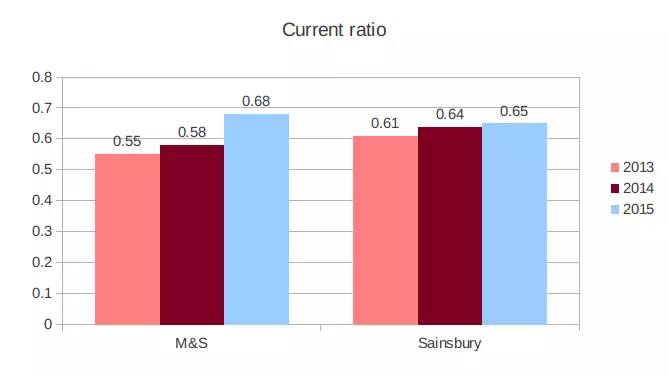
Current ratio
|
Current asset/Current liabilities
|
0.5665773012
|
0.582801192
|
0.6889204545
|
|
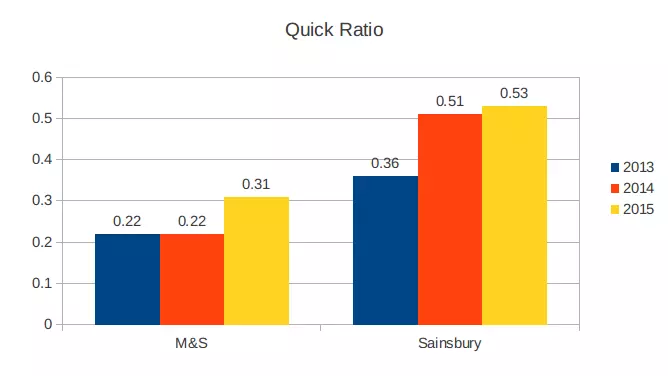
Quick ratio
|
Quick asset/Current liabilities
|
0.2238605898
|
0.2226479353
|
0.3110795455
|
|
Efficiency ratios
|
Â
|
Â
|
Â
|
Â
|
|
Trade receivables
|
Â
|
141
|
181
|
177
|
|
Net credit sales
|
Â
|
10027
|
10310
|
10311
|
|
COGS
|
Â
|
6230
|
6439
|
6326
|
|
Average inventory
|
Â
|
767
|
846
|
798
|
|
Receivables turnover
|
Trade receivables/Net credit sales
|
5.132641867
|
6.40785645
|
6.2656386383
|
|
Inventory turnover
|
COGS/Average inventory
|
8.1225554107
|
7.6111111111
|
7.9273182957
|
|
Solvency ratios
|
Â
|
Â
|
Â
|
Â
|
|
Debt
|
Â
|
1677
|
1606
|
1698
|
|
Equity
|
Â
|
2505
|
2707
|
3200
|
|
Debt to equity ratio
|
Debt/equity
|
0.6694610778
|
0.5932766901
|
0.530625
|
|
Investment ratio
|
Â
|
Â
|
Â
|
Â
|
|
Earning available for shareholders
|
Â
|
467
|
525
|
487
|
|
Outstanding shares
|
Â
|
10000
|
10000
|
10000
|
|
EPS
|
Earning available for equity shareholders/outstanding shares
|
0.0467
|
0.0525
|
0.0487
|
Â
Table 2: Ratios of Sainsbury
|
Particulars
|
Formula
|
2013
|
2014
|
2015
|
|
Profitability ratios
|
Â
|
Â
|
Â
|
Â
|
|
Net sales
|
Â
|
23303
|
23949
|
23775
|
|
Gross profit
|
Â
|
22026
|
22562
|
22567
|
|
Net profit
|
Â
|
614
|
716
|
-166
|
|
Operating profit
|
Â
|
820
|
943
|
76
|
|
GP ratio
|
Gross profit/Net sales*100
|
94.52%
|
94.21%
|
94.92%
|
|
NP ratio
|
Net profit/Net sales*100
|
2.63%
|
2.99%
|
-0.70%
|
|
Operating profit ratio
|
Operating profit/Net sales*100
|
3.52%
|
3.94%
|
0.32%
|
|
Liquidity ratios
|
Â
|
Â
|
Â
|
Â
|
|
Current assets
|
Â
|
1901
|
4362
|
4505
|
|
Current liabilities
|
Â
|
3115
|
6765
|
6923
|
|
Inventory
|
Â
|
767
|
846
|
798
|
|
Quick asset
|
Current asset-inventory
|
1134
|
3516
|
3707
|
|
Current ratio
|
Current asset/Current liabilities
|
0.6102728732
|
0.644789357
|
0.6507294525
|
|
Quick ratio
|
Quick asset/Current liabilities
|
0.3640449438
|
0.5197339246
|
0.5354615051
|
|
Efficiency ratios
|
Â
|
Â
|
Â
|
Â
|
|
Trade receivables
|
Â
|
258
|
1655
|
2055
|
|
Net credit sales
|
Â
|
23303
|
23949
|
23775
|
|
COGS
|
Â
|
22026
|
22562
|
22567
|
|
Average inventory
|
Â
|
987
|
1005
|
997
|
|
Receivables turnover
|
Trade receivables/Net credit sales
|
4.0411105866
|
25.2233913733
|
31.5488958991
|
|
Inventory turnover
|
COGS/Average inventory
|
22.3161094225
|
22.4497512438
|
22.6349047141
|
|
Solvency ratios
|
Â
|
Â
|
Â
|
Â
|
|
Debt
|
Â
|
2478
|
2089
|
2337
|
|
Equity
|
Â
|
5733
|
6003
|
5539
|
|
Debt to equity ratio
|
Debt/equity
|
0.4322344322
|
0.3479926703
|
0.4219173136
|
|
Investment ratio
|
Â
|
Â
|
Â
|
Â
|
|
Earning available for shareholders
|
Â
|
614
|
716
|
-166
|
|
Outstanding shares
|
Â
|
10000
|
10000
|
10000
|
|
EPS
|
Earning available for equity shareholders/outstanding shares
|
0.0614
|
0.0716
|
-0.0166
|
Part 2
Background
The current project report is all about defining various financial statement's in order to assess its efficiency over the years (Grimm and Blazovich, 2016). Both the companies operating in the same industry of supermarket sector are taken into consideration for the purpose of analysis. The marks and Spencer leads all other competitors in the same market by diversifying its existing business into other sectors (Grant, 2016). On the other hand, the Sainsbury operated in the supermarket sector has limited market share than compared to the biggest competitor Tesco. The marks and Spencer have stronger position in relation to the Sainsbury who exists in the same market and supermarket industry. The aim of the current report is to analyses the existing performance of an entity by dividing its financial performance into various segments. Ratio analysis is regarded as one of the important technique used in analyzing the previous year facts and figures as a standard measure. The budgeted figures are used in order to compare the actual figures with the standard performance of the business enterprise (Black and Maggina, 2016).
The current project report aims for analyzing the existing performance of the business in relation with the external market benchmarks. The focus of an entity throughout the project report is to analyze the relationship between internal and external performance of the business. The efficiency of both the companies taken into account in order to form good decisions in the business to take the investment opportunities.
Financial Statement's Analysis
The analyzing the current financial statements prepared by an entity owner in order to remain in the existing market along with all the rivals. It is regarded as one of the process of assessing and analyzing the existing performance in relation with the financial statement's prepared by an entity. The standard forms of financial statement's includes income statement, balance sheet and cash flow statement (Aggarwal and Gupta, 2016). The particular techniques are applied by the business entity in order to evaluates various things such as risks, financial performance and future scope of an organization. The perspectives of different stakeholders are taken into consideration such as employees, owner, management, creditors, investors and the customers. The opinion and consent of all the stakeholders are taken into account in order to form the best appropriate decisions related to the business.
Financial statement analysis will consider two approaches used by the business owner of Sainsbury and Marks and Spencer includes horizontal and vertical analysis. The horizontal analysis will show the previous year increase or decrease in form of percentages from the previous years (Grimm and Blazovich, 2016). On the other hand, vertical analysis will assess the single component of the financial statement on the basis of total of financial statement in a vertical format.
Fundamental analysis is another important tool used in assessing the financial performance of an entity. It is that process which is based on two different streams such as accounting and finance which is used to assess the financial statement of the firm. This particular analysis will assess various components such as assets and liabilities. This analysis will be performed on past and facts and figures in order to ensure the current efficiency of the financial resources held by an entity. The stock opening and closing prices are evaluated which, in turn, increases the chances of the business to invest in a particular company.
Internal And External Ratios
The ratio analysis conducted by an organization are further segmented into two different factors such as internal and external ratios (Grant, 2016). The internal environment refers to all the factors and events takes places in an entity are under the control of the business entity. There are various factors which can affect an entity's existing business performance in relation with both the point of view such as internal and external ratios which is given below:
The liquidity ratios will identify the internal ability or deficiency in not paying their bills and short-term market obligations. The inability of the firm will reveal the inherent risks involved in the business related to the setting of collection and receivables policy. The invoice policies set by an entity need to be rectified in order to support an organization in achieving their project aim.
Other ratios that is the leverage ratios which helps in improving the existing base of financial resources held by an entity in order to meet its existing market obligations (Arif, Noor-E-Jannat and Anwar, 2016). The stability in this kind of ratios will be beneficial for the business entity. The biggest risks faced by an entity is the failure of the business due to deflated results produce by an entity during a financial year.
Profitability ratios which shows the profit earned by an entity in a year after meeting various kinds of expenses. The risks faced by the corporation due to decreasing profitability is lower customer satisfaction which reduces the sales and profit earned by the business entity. The management problems occurred in a business related with the management of overall inventory create further business problems. The problems or issue faced by an entity in relation with these ratios is the risk of market failure by contracting the total market share. The other risks faced by these individuals involves compliance risks, training needs and various maintenance requirements to be fulfilled by an entity in relation with external market.
Ratios Interpretation
Interpretation
The gross profit is regarded as the raw amount of profit generated by an enterprise by deducting cost of sales from the sales figure (Grant, 2016). The Sainsbury has gradually increases its ratio over the year by showing significant increase than M&S. On the other hand, M&S is showing its deficiencies by generating decreasing ratios due to the burden of cost of sales.This is regarded as the complete profit by deducting all kinds of expenses from the figure of sales and the taxation amount. The M&S has generated deflating results by increasing or decreasing but stable position in the external market. On the other side, Sainsbury falls downward by showing negative figure.
Interpretation
The operating profit is obtained after meeting all operating expenses incurred by the business entity (Kim, Li, Lu and Yu, 2016). The results of M&S are declining towards the bottom position by showing higher chances of improving their existing performance. On the other side, the operating profit of Sainsbury is declining by incurring higher operating expenses.
Interpretation
The basic ratio which helps an entity in order to maintain the liquidity of an entity to meet its short term obligations. The performance of both the entities are increasing like a staircase. The M&S has increases with the higher amount but on the other side Sainsbury has increased with fewer amount of increment. The performance of M&S is better than compared to the Sainsbury.
Interpretation
The quick ratio will also one of the components of liquidity ratio which assess the efficiency of current asset excluding the inventory as this will not convert easily into cash (Banerjee, Das, Jana and Shetty, 2016). The performance of the business in relation with the quick ratio is better. The best suitable entity according to this ratio is Sainsbury has it generated higher amount of outcomes than compare with the M&S.
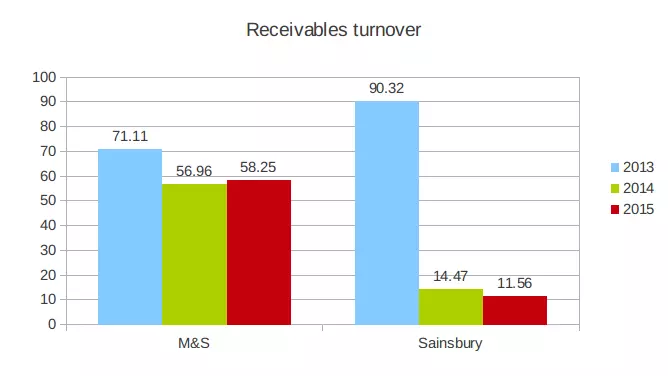
Interpretation
The receivables turnover is calculated in the business enterprise in order to assess the efficiency of the current assets in relation with the sales generated in a year. The M&S has gradually decreases its existing performance by declining but Sainsbury has initially shows higher position which gets declined over the period.
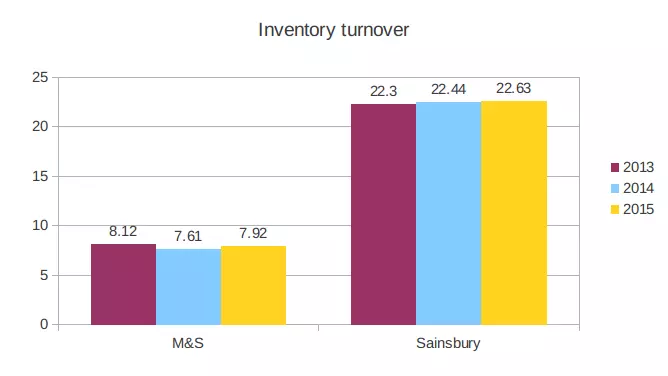
Interpretation
The inventory held by the business are contributed in what proportion in relation to the generation of profit (Black and Maggina, 2016). The Sainsbury has maintained consistency in increasing its performance over the years which reveals that there is high usage of all the inventory in generating sales level. On the contrary, the M&S is decreasing as their stock kept idle in their entity with the increasing number of competition.
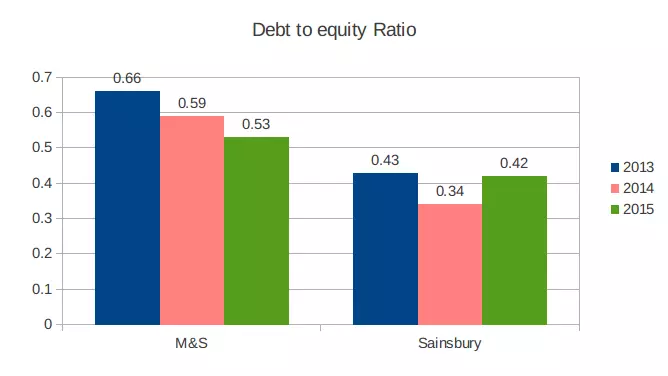
Interpretation
The proportion of debt and equity are assessed which are essential component of a capital structure of the business entity (Hofmann and Lampe, 2013). The performance of Marks and Spencer are backwardly moved downward due to the involvement of higher debt component. The Sainsbury on other side, fall towards bottom only in 2014 as it has good position in both the years.
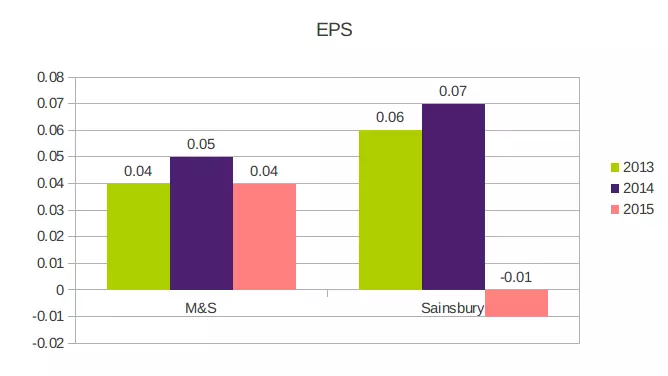
Interpretation
The investors invest in the business of both the entities with the good financial performance by reflecting higher Earning per share. M&S has maintained the stability while generating same earning per share due to similar number of outstanding shares. Sainsbury has generated negative results due to loss suffered by an entity over the years.
Share Price Evaluation
Both above mentioned entities such as Sainsbury and marks and Spencer are listed in the London stock exchange in order to reflect the legal identity of the business (Tan, and Robinson, 2014). The movements take places in the share price are required to be observed as the wealth of the shareholders are on stake.
Marks and Spencer
The share price of Marks and Spencer are increases along with the passage of time which reveals that it shows increasing trend. This increasing trend will be beneficial for the business entity which increases the existing base of investors who invest in the business concern operated by this particular entity.


The current interactive charts regarding the share prices of this entity will further helpful for the business in predicting its future trade with wide number of customers in form of investors and shareholders.
Interpretation
The share price offered to the variety of investors in order to invest in their business are declining over the years. The external market risks that is the existence of strong market competition faced by this enterprise.
Interpretation
The performance is predicted by this entity is fluctuating as there is no stability in the shares price offered by this entity to the variety of users (Damodaran, 2016). The current business performance of Sainsbury is not good but its future performance is better than compared with the Marks and Spencer.
Recommendation
The investment in the business of Sainsbury and Marks and Spencer is based on the current performance of both the entities (Clark, 2016). It can be recommended to an individual to invest in the business of Marks and Spencer on the basis of share price efficiency over its competitors. The selection of an entity in order to invest and taken the share in a business also make on ratio analysis. The ratio analysis has agreed with the fact that financial performance of marks and Spencer is better than Sainsbury by assessing its performance on various parameters. These criteria include profitability, efficiency, liquidity, investment and solvency ratios.
Conclusion
It can be concluded from the above project report that financial capabilities are assessed by applying various techniques of ratio analysis and evaluation of share price. The application of above techniques it has been found that marks and Spencer is the best option for an enterprise in order to invest in the both the
Amazing Discount
UPTO50% OFF
Subscribe now for More
Exciting Offers + Freebies


 Super-fast Services