How to Make BCG Matrix in Brand Management Assignment?
Affordable Prices
Top Grades at Cheap Rates!
Paraphrasing Tool
Add variations in content without altering the meaning.
Grammar Checker
Remove grammatical errors, typos and spelling mistakes.
Essay Typer
Impressive Essays in Minutes with Best Essay Typer Tool.
Plagiarism Tool
Check similarity in content & get a free plagiarism report.
Thesis Generator Tool
Create a Mesmerizingn Thesis Statement with our tool.
Dissertation Outline Tool
Create a concise dissertation summary with our tools help.
AI Essay Writer
Acquire top-quality essays with original content and no grammatical errors.
Do you like chocolates? Oh! Why are we even asking this, almost every student on the planet loves them, we guess you too? So, how do you decide which chocolate to eat? Most probably, you compare them based on various factors such as taste, price, ingredients, etc. Is the comparison easy? No. It is a lot more difficult than anybody could imagine. You know what, the brand managers of your favorite chocolate brands do these comparisons and analysis regularly to determine where the resources should be allocated and how to market the product. The students, like you, who come to us in need of brand management assignment help, wonder how is this done. Then, we explain to them about BCG matrix, an easy chart used by marketing wizards across the globe. Since you are required to make it in the document, we have decided to elaborate the same through this blog.
Let’s begin our explanation of the BCG matrix with a general overview about what does it mean.
BCG matrix is a chart formulated by Bruce D. Handerson in 1970. It is used by companies to decide where to deploy their resources and how to market the brands effectively.
Now that you know what the BCG matrix chart is, you must be excited to know how to make one in the assignment, right? Well, go through the next segment to get familiarized with the best step-by-step guide to create it.
Since the deadline is approaching, let’s not waste time. Here we share the steps you require to make BCG matrix chart in the assignment. Go through them with the utmost attention without letting any distraction hamper your concentration.
How can you analyze something when you don’t know what needs to be analyzed? According to our experts, doing this is impossible. Therefore, if the professor has not assigned a particular product line, the process of making the BCG chart begins with deciding what brands you’ll be analyzing and the analysis unit.
Now that you have decided the brands or their components you wish to analyze, the next step is to describe the market under which it falls. Remember, an incorrect description can never lead to a correct analysis. For example, if you define Lamborghini’s market as passenger car’s segment, then you’ll never be able to analyze it accurately. The cars like these fall within the purview of luxury car markets.
After defining the product market, the next step of the process is to calculate the relative market share. Confused about how to do it? Well, do not be. There is an easy formula for its computation. Here we share the same.
Relative Market share of a brand = The Brand’s share or revenues/ Share or revenues of the competitive brand
Plot the result on the graph’s X-axis.
Now that you have calculated the relative market share, the next crucial step is to calculate the market growth rate. Here you need to compute how much the industry has grown over the years as a whole. Do not know how to do it? Well, you can do it easily by analyzing the growth rate of the leading brands in the industry.
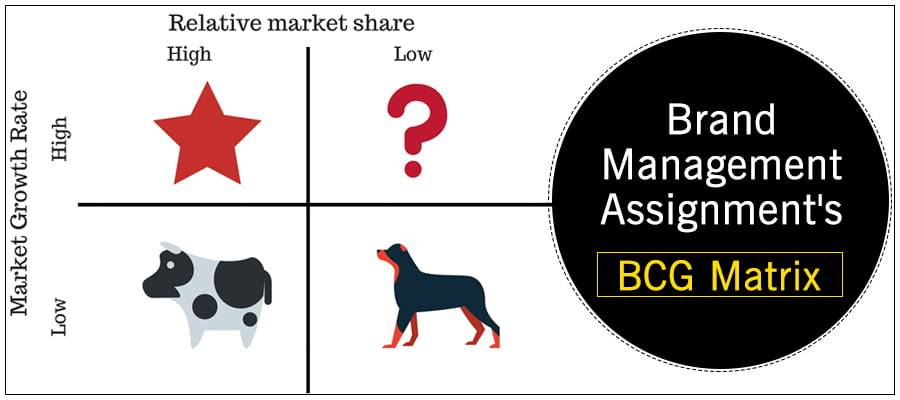
Celebrate. Why? Well, you have reached the last step of making the BCG chart. Now, you have to put all the measures calculated in the above-mentioned steps onto the four coordinates of the matrix. Wondering what are they? Well, here we have defined each one of them.
Now can you make the BCG matrix in the assignment effortlessly? We hope, yes. But, if your views are different or you need any other assistance to compose the document, then feel free to contact us for the best management assignment help. Our experts are subject wizards, they’ll be your helping hand and guide you in the right direction.
You May Also Like to Read- Confirmation Bias: Types, Impact and Ways to Avoid It

Grab this exclusive offer and start your journey to savings today! Act quickly, as this special offer won't be around for long!

This blog explains what is a hyperbole, provides engaging examples, & explores how to use hyperbole.

Explore 150+ funny debate topics to spark laughter, creativity, and lively discussions in 2025

Cross-Sectional Study basics explained with steps, examples, and comparisons.
Limited Time Offer
Exclusive Library Membership + FREE Wallet Balance
1 Month Access !
5000 Student Samples
+10,000 Answers by Experts
Get $300 Now
![]() Update your Number
Update your Number


 Call us: +61 483982483
  Whatsapp: +61 483982483
  help@globalassignmenthelp.com.au