Question :
Task
You are required to conduct financial analyse to find out the financial solutions for the last three years from their balance sheet. Follow the attached structure.
Produce a report of 2500 words and provide the key accounting ratios to examine the financial performance and position of Mother care plc. Also made comparative numerical ratios for each of the last three years and explain the trends with the help of these ratios.
Evaluate and justify three key strategic decisions which you believe the organisation should take as a result of the financial analysis.
Executive summary
1. Introduction
Demonstrate your organisation Mother care plc and what has happened to this company.
2. Examine and analyse the impact of economy has on business organisation.
Micro factors that contributes towards the business failure.
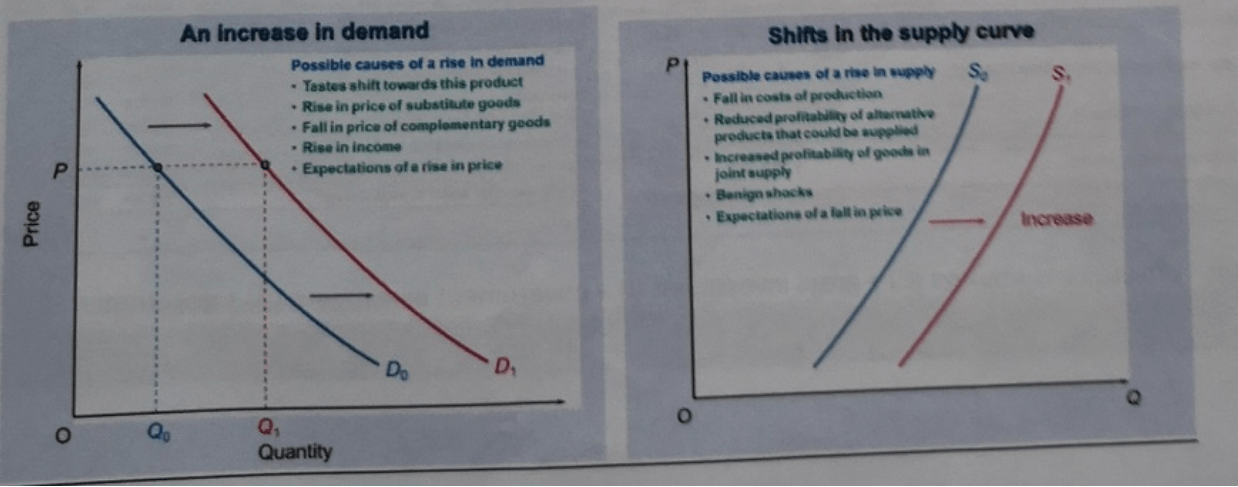
2.1 Supply and Demands of goods
- Fundamental principles of supply and demand
- Elasticity of demand and elasticity of supply
- Use company of your choice- Use Statistical data if available.
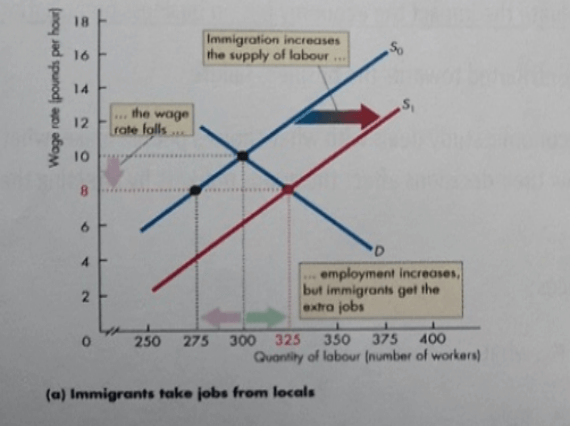
2.2 Evaluation of Micro Factors- Immigration lreduce wages and Takes Jobs (example)
With no immigration, 300 locals work for € 10 an hour.
With immigration, the supply of labour increases, the wage rate falls to € 8 an hour.
The number of jobs increases to 325.
Only 275 locals are willing to work for €8 an hour, so immigrants get the 25 new jobs and take 25 jobs from locals.
2.4 Macro forces that contributed towards the company failure.
- Growth- data and statistics
- Unemployment – data and statistics
- Inflation- data and statistics
- Balance of Trade deficits- data and statistics
- Cyclical fluctuations- data and statistics
The Unemployment rate
The unemployment rate is the percentage of the workforce that is unemployed.
The unemployment rate is (Number unemployed + workforce) *100
In June 2016, the number employed was 31.8 million and the number unemployed was 1,6 million.
The workforce was (31.8+1.6) million =33.4 million.
So, the unemployment rate was (1.6+31.8) *100, or
- Apply employment – Inflation-GDP and other economic data to how these have affected your company.
- Analyse Financial Information from a range of business organisation.
3.1 Profitability Ratios
Profitability ratios is a defined as financial metrics used by investors to analyse the ability of a company to gain income and profit earning capacity, balance sheet assets, operating costs, and shareholder's equity during a certain period of time. It highlights how well company utilizes its assets to provide profit and value to its shareholders.
Gross Profit percentage = GP/Ne Sales*100
Interpretation of information to develop decision making
3.2 Liquidity Ratios
Liquidity Ratios are used to measure the ability of an organisation to pay off its short term obligations. It is mainly used by creditors and lenders to decide whether to extend credit or debit respectively to companies.
Current Ratios= Current assets/ Current liabilities
3.3 Leverage Ratios
Leverage ratios are used to identify the relative level of debt that a business has incurred.
Debt Ratio= Total Liabilities /Total Assets
3.3 Efficiency Ratios
The total asset turnover ratios compare the sale of a company to its asset base. It measures the ability of an organisation and analyse the operation of a business.
Asset Turnover= Net Sales/ Average total assets
4.0 Provide proper course of Action informed b Accounting tools and concepts
Analyse the viability of a product using investment appraisal techniques. In a new strategy aiming to increase products range of Imad's luxury Ltd. Has been presented with 3 new produce opportunities. You have been asked to examine which company want to produce and sell.
|
O investment
|
80000
|
1,50,000
|
80000
|
|
1 cash in Flow
|
35000
|
30000
|
40000
|
|
2 cash in flow
|
35000
|
45000
|
40000
|
|
3 cash in flow
|
40000
|
75000
|
20000
|
|
4 cash in flow
|
50000
|
75000
|
25000
|
|
Total
|
€ 1,60,000
|
€ 2,25,000
|
€ 1,25,000
|
Answer :
1.0 INTRODUCTION
The term economics is a key aspect of external which has a significant impact on financial performance of business entities (Persson and Tabellini, 2016). In the project report a company has been chosen that is Mother care plc. This company is a British retailer that provides products for expectant mothers and for children up to 8 years. It is listed on London stock exchange. In January 2019, Mother care plc faced that about 79 stores in UK, refused to take products from them. The reason of this lower sales was increasing in online sales and increased competition.
You Share Your Assignment Ideas
We write it for you!
Most Affordable Assignment Service
Any Subject, Any Format, Any Deadline
Order Now View Samples
2.0 Identify and evaluate the impact of economy on business organisations
2.1 Supply and demand of goods
- Principle of supply and demand:
Principle of supply- The supply can be defined as amount of goods and services are available to customers. It is based on a principle which is that keeping other factors constant, a raise in prices may lead to increase in supplied quantity. In the aspect of above mother care plc, if price of their products will raise then supply of products will also increase vice versa.
Principle of demand- In the economics, demand can be defined as quantity of goods and services which consumers like and able to buy at different prices during a particular time frame. Principle of demand states that if prices of goods and services will increase then demand will decrease, vice versa. In the aspect of above company, if they will decrease prices of products then demand will raise.
- Elasticity of demand and supply-
Elasticity of demand- It is defined as a variation in price of a product which affects the demand. This is computed by % change in quantity demanded by % change in a variable on that demand depends.
Elasticity of supply- This is defined as % change in prices to % change in quantity supplied of a particular commodity.
2.2 Micro factors
The micro factors have a significant impact on companies financial performance. In the aspect Mother care company, these factors can affect in such manner:
- Impact of immigration- In the case when there is no immigration then labour rate will be higher and if there will be immigration then labour rate will fall down. In the aspect of above company, they can be affected from this factor if rate of labour will fluctuate due to higher immigration.
- Number of job increases- In addition, if number of jobs increases at the time of immigration then labour force will be agree to do job at lower rate (Sahlins, 2017). In the Mother care company, they can fulfil their vacant posts in the case when there is immigration.
2.3 Macro factors
Along with the micro factors, macro factors also affect companies performance. This is so because:
- Unemployment- This is a key factor of an economy that can impact to financial performance of companies. It is so because in a nation if unemployment rate will higher then this will be difficult for corporations to provide jobs to freshers and attract more number of customers because of lack of source of income. Along with demand of goods will also lower. Below data of unemployment of UK in last three years is mentioned which can affect above chosen company:
|
Year
|
Unemployment rate
|
|
2016
|
4.9
|
|
2017
|
4.4
|
|
2018
|
4.1
|
This chart shows that unemployment rate is decreasing and it will make a positive impact on Mother-care company's performance. It is so because if people will have jobs then they will demand for more products.
- GDP growth rate- This is also a key element of economy which can affect companies performance. It is so because if growth rate will lower then companies will not be able to do more expand and investment. In the aspect of above company, they are affected from this factor because growth rate of UK has been decreased in some years that is presented below:
|
Year
|
GDP growth rate
|
|
2016
|
1.90%
|
|
2017
|
1.80%
|
|
2018
|
1.40%
|
- Inflation rate- This is rate which can impact companies performance negatively if there is higher fluctuation (Gilman, 2018). In the aspect of UK's economy, this can be find out that their inflation rate is higher after year 2016 and as a result above company affected from this.
|
Year
|
Inflation rate
|
|
2016
|
0.70%
|
|
2017
|
2.70%
|
|
2018
|
2.50%
|
3.0 Financial information of the organizations
3.1 Profitability Ratios
It is one of the branch of financial metrics that is used to evaluate the earning ability of the company in comparison to revenue. It also helps in measuring company's performance for the specific duration.
Gross profit ratio: It is profitability ratio which is calculated by the organizations to identify operational performance of the business. It shows the relationship between gross profit or net profit of the company. Its calculation mentioned below along with the formula:
Formula:
Gross Profit Ratio = Gross Profit / Net Sales * 100Â
Calculations:
|
Items
|
2016 (£'m)
|
2017 (£'m)
|
2018 (£'m)
|
|
Gross Profit
|
60.2
|
58.8
|
34
|
|
Net Sales
|
682.3
|
667.4
|
654.5
|
|
Gross Profit Ratio
|
8.82 %
|
8.81 %
|
5.19 %
|
Interpretation:
The chart shows that gross profit ratio of company is decreasing in all three years. Such as in year, 2016 this was of 8.82% that became of 5.19% in last year. It is so because their gross profits are decreasing with huge margin in all three years.
3.2 Liquidity ratio
This ratio used to calculate the debtor's ability in order to pay off their short term obligations and it is only when company have enough liquidity. In order to measure liquidity of business operations, company calculate different ratios such as current ratio or quick ration.
Current ratio: This ratio calculate to identify the resources and its ability to perform their task or able to meet with short term obligations (Shiller, 2017). It is calculated by dividing current assets with current liability and its ideal ratio is 2:1.
Formula:
Current Ratio = Current Assets / Current LiabilityÂ
Calculations:
|
Items
|
2016 (£'m)
|
2017 (£'m)
|
2018 (£'m)
|
|
Current Assets
|
203.6
|
178.2
|
151.6
|
|
Current Liability
|
145.8
|
136.2
|
134.4
|
|
Current Ratio
|
1.39
|
1.30
|
1.12
|
Interpretation:
On the basis of current ratio of company, this can be find out that it is not in ideal form which is 2:1 times. The graph shows that current ratio of company is decreasing in all three years. Like in year 2016, it was of 1.39 times that became of 1.3 times. It is so because of higher value of liabilities.
3.3 Leverage Ratio
This ratio used to calculate the proportion of debt in comparison to equity or any other capital. There are various ratios which business used to calculate such as shareholders equity or debt to equity.
Debt ratio: It is financial ratio which is required to calculate for the identification of total debt and its ability to pay off which helps in measuring company's leverage (Redding and Rossi-Hansberg, 2017). Ideal ratio is 1:1, so company should focus on maintaining ideal ratio for the effective performance.
Formula:
Debt Ratio = Total Liabilities / Total AssetsÂ
Calculations:
|
Items
|
2016 (£'m)
|
2017 (£'m)
|
2018 (£'m)
|
|
Total Liabilities
|
258.3
|
266.4
|
263.1
|
|
Total AssetsÂ
|
347.4
|
347.8
|
276.7
|
|
Debt Ratio
|
0.74
|
0.76
|
0.85
|
Interpretation:
On the basis of above presented graph, this can be interpreted that debt ratio of company is increasing in a significant manner which is not a good sign. Like in year 2016, it was of 0.74 that raised and became of 0.76 in year 2017. This is so because of higher liabilities in all three years.
3.4 Efficiency Ratio
It is another financial metrics where organizations use this ratio which indicate total expenses in comparison to the revenue of the company for the period. Management try to minimise this ratio so they can generate more profit or get higher growth.
Assets turnover ratio: This ratio used to measure company's revenue in comparison to total value of assets (Rodrik, 2018). Those organizations have low profit margin, it founded that they have high assets turnover. Calculation based on Mother care plc which mentioned below:
Formula:
Assets Turnover Ratio = Net Sales / Average Total Assets
Calculation:Â
|
Items
|
2016 (£'m)
|
2017 (£'m)
|
2018 (£'m)
|
|
Net Sales
|
682.3
|
667.4
|
654.5
|
|
Average Total Assets
|
278.2
|
347.6
|
312.25
|
|
Assets Turnover Ratio
|
2.45
|
1.92
|
2.09
|
Interpretation:
On the basis of above presented chart, this can be find out that assets turnover ratio of this company is fluctuating in all years. Such as in year 2016, it was of 2.45 times that reduced and became of 1.92 times. While in next year 2018, it raised and became of 2.09 times. This shows that company is unable to generate consistent return on assets.
Working Notes:
Average Total Assets = ( Beginning assets + Ending assets ) / 2
2016 = ( 6910 + 6908 ) / 2 = 6909
2017 = ( 7115 + 347.8 ) / 2 = 7012.5 or 7013
2018 = ( 347.8 + 7115 ) / 2 = 7332
4.0 Investment Appraisal TechniquesÂ
In this section of report, calculation based on Imad's luxury Ltd which has three different opportunities. By using investment appraisal technique, managers have to make decisions that in which products company should invest. Comparison will be based on different aspect such as NPV, IRR, ARR or Payback period. Its calculation mentioned below:
4.1 Payback Period
It is one of the most effective method of capital budgeting which refer to the time which is taken by the organizations to recover their initial investment (Eichholtz, Kok and Quigley, 2013). Basically it means, in how much time company will recover their invested amount in particular project. Lower the payback period is beneficial for the organizations or managers can make quick decisions on the basis of it. By using this method, managers of Imad's luxury Ltd able to make judgement that which product the need to produce or sell in the market.
Payback Period:
|
Year
|
Product 1
|
CCF
|
Product 2
|
CCF
|
Product 3
|
CCF
|
|
Year 0
|
80,000
|
-
|
150,000
|
-
|
80,000
|
-
|
|
Year 1
|
35,000
|
35,000
|
30,000
|
30,000
|
40,000
|
40,000
|
|
Year 2
|
35,000
|
70,000
|
45,000
|
75,000
|
40,000
|
80,000
|
|
Year 3
|
40,000
|
110,000
|
75,000
|
150,000
|
20,000
|
100,000
|
|
Year 4
|
50,000
|
160,000
|
75,000
|
225,000
|
25,000
|
125,000
|
Formula:
Payback Period = Year + Unrecoverable cost / cash flow during the year
Product 1 = 2 + ( 10000 / 40000 )
= 2.25 years
Product 2 = 3 years.
Product 3 = 2 years.Â
4.2 Net Present Value
NPV is the another method of capital budgeting which is used to evaluate investment proposal and how effective or beneficial it is for the company (Camerer et.al, 2016). Basically it is the difference between present value of cash inflow or present value of cash outflow. Higher NPV means investment is profitable for the company. Management will adopt this method to evaluate their investment and make further decisions accordingly.
Formula:
NPV = Present Value of Cash Inflow – Present Value of Cash Outflow
Product 1:
|
Year
|
Product 1
|
Present Value @ 10%
|
Dis Cash Flow
|
Present Value @ 35%
|
Dis Cash Flow
|
|
0
|
80,000
|
1
|
-80000
|
1
|
-80000
|
|
1
|
35,000
|
0.909
|
31818
|
0.741
|
25926
|
|
2
|
35,000
|
0.826
|
28926
|
0.549
|
19204
|
|
3
|
40,000
|
0.751
|
30052
|
0.406
|
16258
|
|
4
|
50,000
|
0.683
|
34151
|
0.301
|
15053
|
|
NPV
|
 44,947
|
 -3559
|
Product 2:
|
Year
|
Product 2
|
PV @ 10%
|
DCF
|
PV @ 20%
|
DCF
|
|
0
|
150000
|
1
|
-150000
|
1
|
-150000
|
|
1
|
30000
|
0.909
|
27272
|
0.833
|
25000
|
|
2
|
45000
|
0.826
|
37190
|
0.694
|
31250
|
|
3
|
75000
|
0.751
|
56349
|
0.579
|
43403
|
|
4
|
75000
|
0.683
|
51226
|
0.482
|
36169
|
|
NPV
|
22,037
|
 -14,178
|
Product 3:
|
Year
|
Product 3
|
PV @ 10%
|
DCF
|
PV @ 25%
|
DCF
|
|
0
|
80000
|
1
|
-80000
|
1
|
-80000
|
|
1
|
40000
|
0.909
|
36364
|
0.800
|
32000
|
|
2
|
40000
|
0.826
|
33058
|
0.640
|
25600
|
|
3
|
20000
|
0.751
|
15026
|
0.512
|
10240
|
|
4
|
25000
|
0.683
|
17075
|
0.410
|
10240
|
|
NPV
|
21,523Â
|
-1,920
|
4.3 Internal Rate of Return
This method helps in identifying return of investment which is taken by the organizations for the purpose of maximising their earnings (Ciaian, Rajcaniova and Kancs, 2016). At the time of making decisions regarding investment, managers will compare different projects on the basis of high IRR that is beneficial as well as profitable for the company. If IRR is high, then it will be selected and if low then rejected. Imad's luxury Ltd follow this technique to make their decisions regarding selection of product which they has to select to manufacture or sell.
Formula:
Product 1:
IRR = 10 + {44,947 / [ 44,947 - (-3559 )]} * ( 35 – 10)
= 10 + {0.926 * 25}
= 10 + 23.15
= 33.15%
Product 2:
IRR = 10 + {22,037 / [ 22,037 - (-14,178 )]} * ( 20 – 10)
= 10 + {0.608 * 10}
= 10 + 6.08
= 16.08%
Product 3:
IRR = 10 + { 21,523 / [ 21,523 - (-1,920 )]} * ( 25 – 10)
= 10 + { 0.918 * 15 }
= 10 + 13.77
= 23.77%
4.4 Accounting Rate of Return
It is the financial ratio which is used for capital budgeting but it does not consider the time value of money. Basically it is the return which is calculated on the basis of net income of the project. It help in comparing different project and managers will consider the higher return project on the basis of ARR.
Formula:
- ARR = Average Net Profit / Initial Investment * 100
|
Initial Investment
|
Average Net Profit
|
Workings
|
ARR
|
|
Product 1
|
80000
|
40000
|
40000 / 8000 * 100
|
50
|
|
Product 2
|
150000
|
56250
|
56250 / 150000 * 100
|
37.5
|
|
Product 3
|
80000
|
31250
|
31250 / 80000 * 100
|
39.06
|
|
Workings:
|
Product 1
|
Product 2
|
Product 3
|
|
160000 / 4
|
225000 / 4
|
125000 / 4
|
|
Average Net profit:
|
40000
|
56250
|
31250
|
Comparison of three different products by using investment appraisal techniques:
|
Product
|
PP
|
NPV
|
IRR
|
ARR
|
|
1
|
2.25
|
44,947
|
33.15
|
50
|
|
2
|
3
|
22,037
|
16.08
|
37.5
|
|
3
|
2
|
21,523
|
23.77
|
39.6
|
On the basis of above comparison it has been evaluated that Imad's luxury Ltd should produce Product 1 and sell in the market because it will provide higher returns. Such as NPV of this products is 44,947, payback period is 2.25 years which means company recover their initial investment in this period. IRR is 33.15 and ARR is 50 that is maximum from among three products. Company will decided to manufacture Product 1 that is more beneficial as well as profitable for the organizations. After that, 3rd product is most suitable which has more attractive returns. But, among three opportunities Product 1 is most suitable or profitable for Imad's luxury Ltd.
5.0 CONCLUSION
From the above discussion it has been concluded that, there are various factors which affect the business and its operational profit. Such as micro or macro factors which includes mitigation of workers, unemployment, growth etc. In addition, with the help of financial analysis managers able to understand the financial position as well as performance in the market. Its analysis will helps making strategies or perform accordingly to improve productivity as well as profitability.
6.0 RECOMMENDATIONS
On the basis of above mentioned financial performance of company, below recommendation are needed to be followed by company:
- Mother care company should focus on minimising cost of sales so that their gross profit may increase.
- As well as company should try to increase their current assets so that their liquidity position can be improve.
- Company should focus on enhancing their operations and activities so that their turnover ratios can be improve.
- Along with company must align their policies and plans with consideration of macro and micro factors.
You may also read more samples -Â
What is securitization? How does it contribute to global financial system
Overview of Low Socioeconomic Conditions
Demand and Supply Analysis for Housing Sector UK
BM533 Contemporary Business Economics
Amazing Discount
UPTO55% OFF
Subscribe now for More
Exciting Offers + Freebies
Download Full
Sample